Beer, bikes and bananas
I've been learning about the carbon footprint of everything. And here are some of the things I've learnt so far.
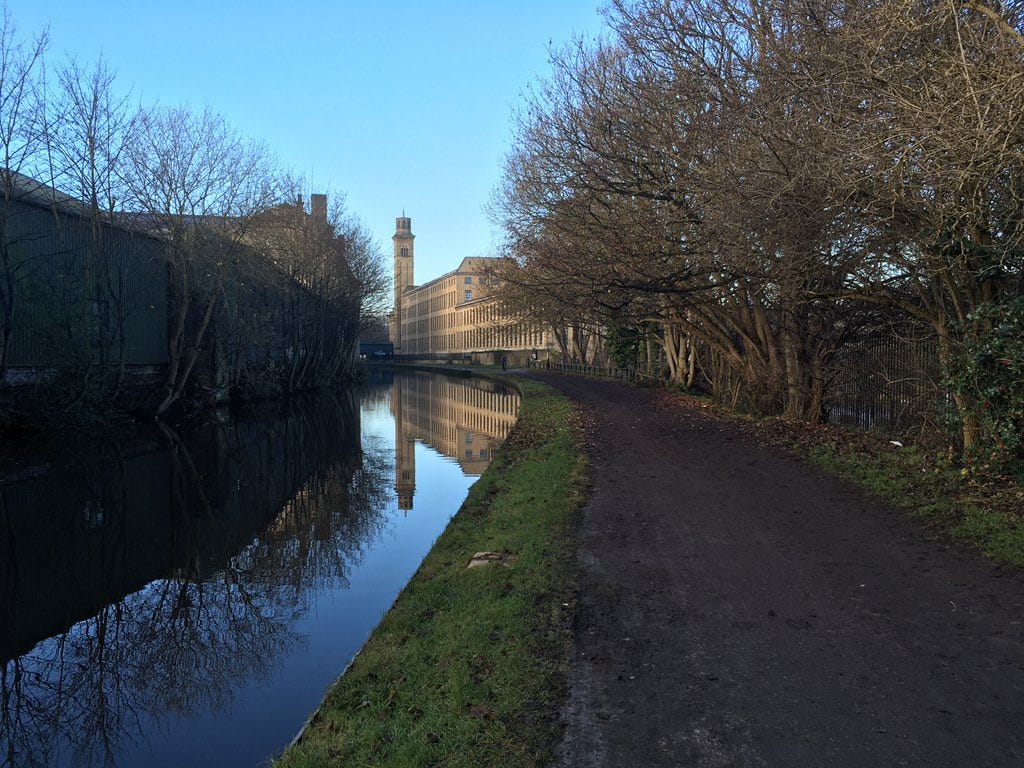
I went for a bike ride along the Leeds-Liverpool canal at the weekend with a group of friends.
We rode from Leeds up to the World Heritage Site of Saltaire.
We aim to meet up once a month, and one thing that was notable this time was that more of us were on electric bikes than mountain bikes.
That’s reflective of the massive increase in interest in electric bikes over the last few years.
And even though I was on a mountain bike on Saturday, I am a fully signed up member of the ebike fan club, as my Twitter followers know only too well.


E-bikes v “normal” bikes - which has the bigger carbon footprint?
As I was riding along the canal (and yes, to be honest, struggling a bit to keep up), it got me thinking - how does the carbon footprint of traveling by e-bike compare with a journey on a non-assisted bike?
It was on my mind as I recently bought How Bad Are Bananas - The Carbon Footprint of Everything - by Mike Berners-Lee - so I had a little look in there on Sunday.
And sure enough, Mike’s done the calculations.
I won’t go into all the detail here - in part because there are various assumptions made in the calculations and I don’t want to start an argument by oversimplifying.
But might it surprise you to learn that riding the e-bike has a lower carbon footprint than the non-assisted bike?
There are various reasons for this - primarily to do with what powers the bike along.
At one end of the scale, you’ve got an e-bike powered by 100% renewable energy - or perhaps solar panels on your roof at home. That’d be somewhere between 3g and 5g CO2e (CO2 equivalent) per mile.
And then we’ve got more conventional pedal power - powered perhaps by bananas, (40g CO2e per mile), a cheeseburger (310g CO2e per mile), or (probably not the go-to snack of many cyclists) a plate of air-freighted asparagus (4.7kg CO2e per mile).
Now of course, there are all sorts of assumptions made there (and yes as an electric cyclist myself I know you still need to pedal) - and these assumptions are well explained in the book - including the need to account for the embedded carbon in the bike (and battery).
But what I like about the book is that comparisons like this get you thinking about the detail.
And that detail, over time, helps you to develop what Mike calls your “carbon instinct” - so you get better at guessing whether a particular activity is likely to be carbon-intensive or not.
And that brings me onto the beer
Most of our rides include a stop off for a pint.
There are few better places round here to stop off than Saltaire Brewery - it’s a beautiful, totally traffic free 20km ride along the canal from Leeds.
The beer in their Brewery Tap is, as you’d expect, as fresh as you can get.
And it tastes pretty good too.
But what about its carbon footprint?
Once again, Mike’s done the calculations - based around some work he did with a medium-sized brewery in Leicestershire.
And his estimates vary from 650g CO2e for a locally-brewed cask ale in a pub, through to 910g CO2e for a foreign beer at the pub, or 1kg CO2e for a long-distance bottled beer from a shop.
The detail is all there in the book, but you can probably imagine where the impacts come from - including the energy used to produce the beer, the ingredients themselves, and travel & distribution.
Obviously travel is one reason why the local brew will usually come out on top when it comes to carbon footprints.
And I for one am happy to do all I can to support those local brewers, with pedal power and the occasional boost from a battery.
You can find out more about How Bad Are Bananas? here.


